Understanding the Sales dashboard
The Sales dashboard gives a quick, graphical overview of sales performance. From this dashboard, you can compare sales performance between different time periods and easily access additional reports if particular numbers require more information.
Customize the dashboard according to your business needs to have essential reporting data readily available at a glance. This report includes data on total revenue, bestsellers, top-selling employees, cash reports, best customers, popular payment methods, and shift performance.
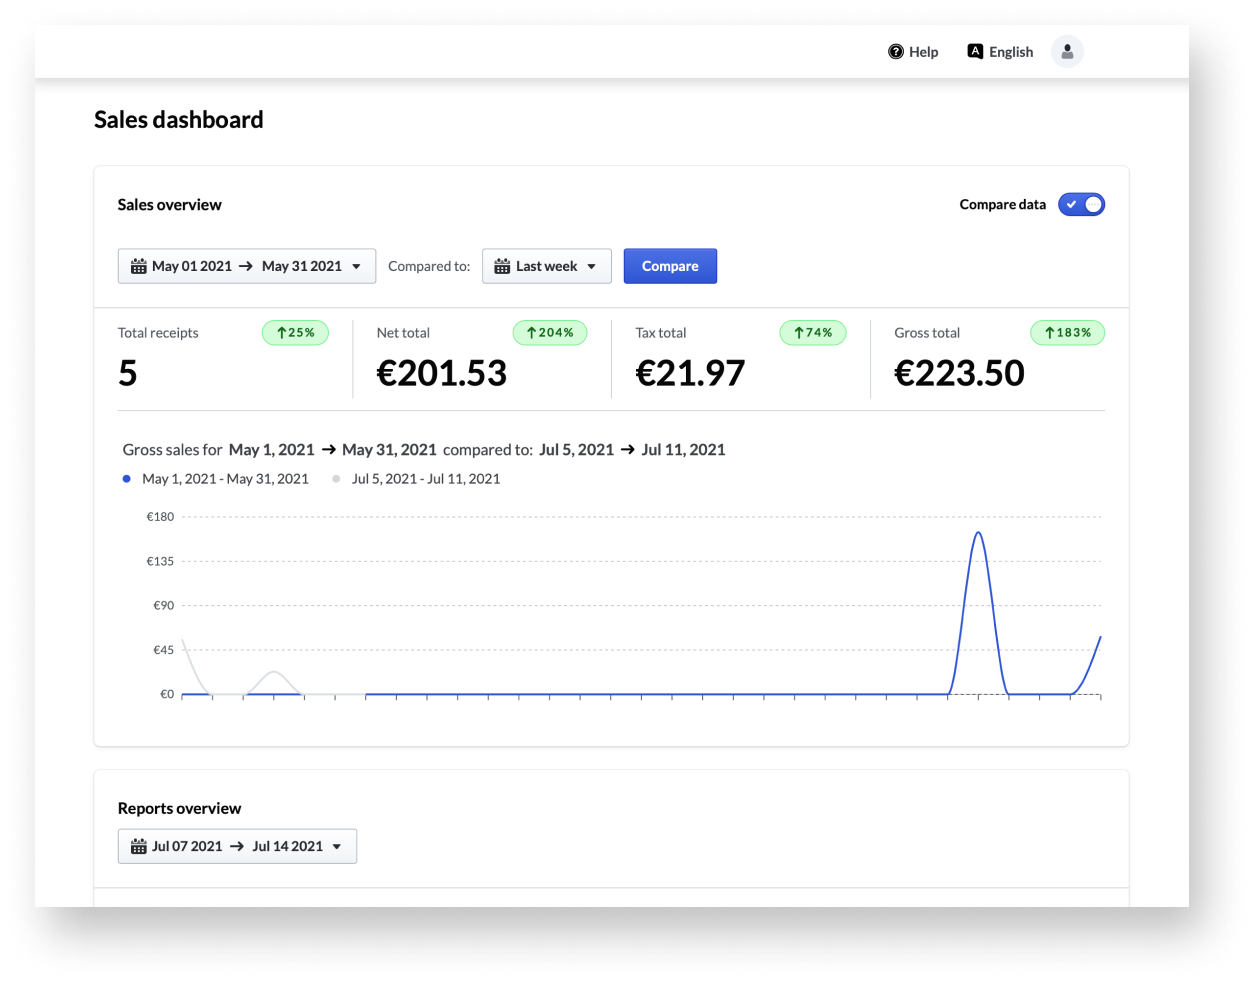
Understanding the sales overview
Get an overview of your daily gross sales, the weather, and the impression (the stars to rate the day’s performance by POS users when opening a sales period) illustrated by a line chart.
- Log in to the Back Office with your Lightspeed Restaurant credentials.
- Select Reports > Sales dashboard from the navigation bar.
- To adjust the reporting period, follow steps 4a–4c:
- Click the calendar icon.
- Define the period: Day, Week, Month, or Year.
- Click Apply.
- Review sales overview data.
- Hover over the chart to get the exact amount of gross sales for the selected time.
Comments
0 comments
Please sign in to leave a comment.