KDS Statistics
In this article
- Accessing KDS Statistics
- Viewing KDS Statistics graphs
If you use a kitchen display system (KDS), use the KDS Statistics report to see the total number of products prepared, the average preparation times for each product, and which products are prepared fastest or slowest. This report makes it easier to assess how long it takes to serve different orders, letting you make informed decisions about the menu and staffing. For example, use this report to see which dishes are taking more time than expected to leave the kitchen or if particular days and service periods are seeing a lower-than-expected performance. Each row on the table of this report represents a single menu item.
Accessing KDS Statistics
To access the KDS Statistics report:
- Log in to the Back Office using your Lightspeed credentials.
- Select Reports>Reports from the navigation menu.
- ClickKDS Statistics in the sales Report section.
- Use the drop-down menu and calendar icon in the upper-right corner to change the report's time period.
- (Optional) ClickView graphs within the respective row to view detailed information about an item's production time. For descriptions of the available graphs, see viewing KDS Statistics graphs.
Viewing KDS Statistics graphs
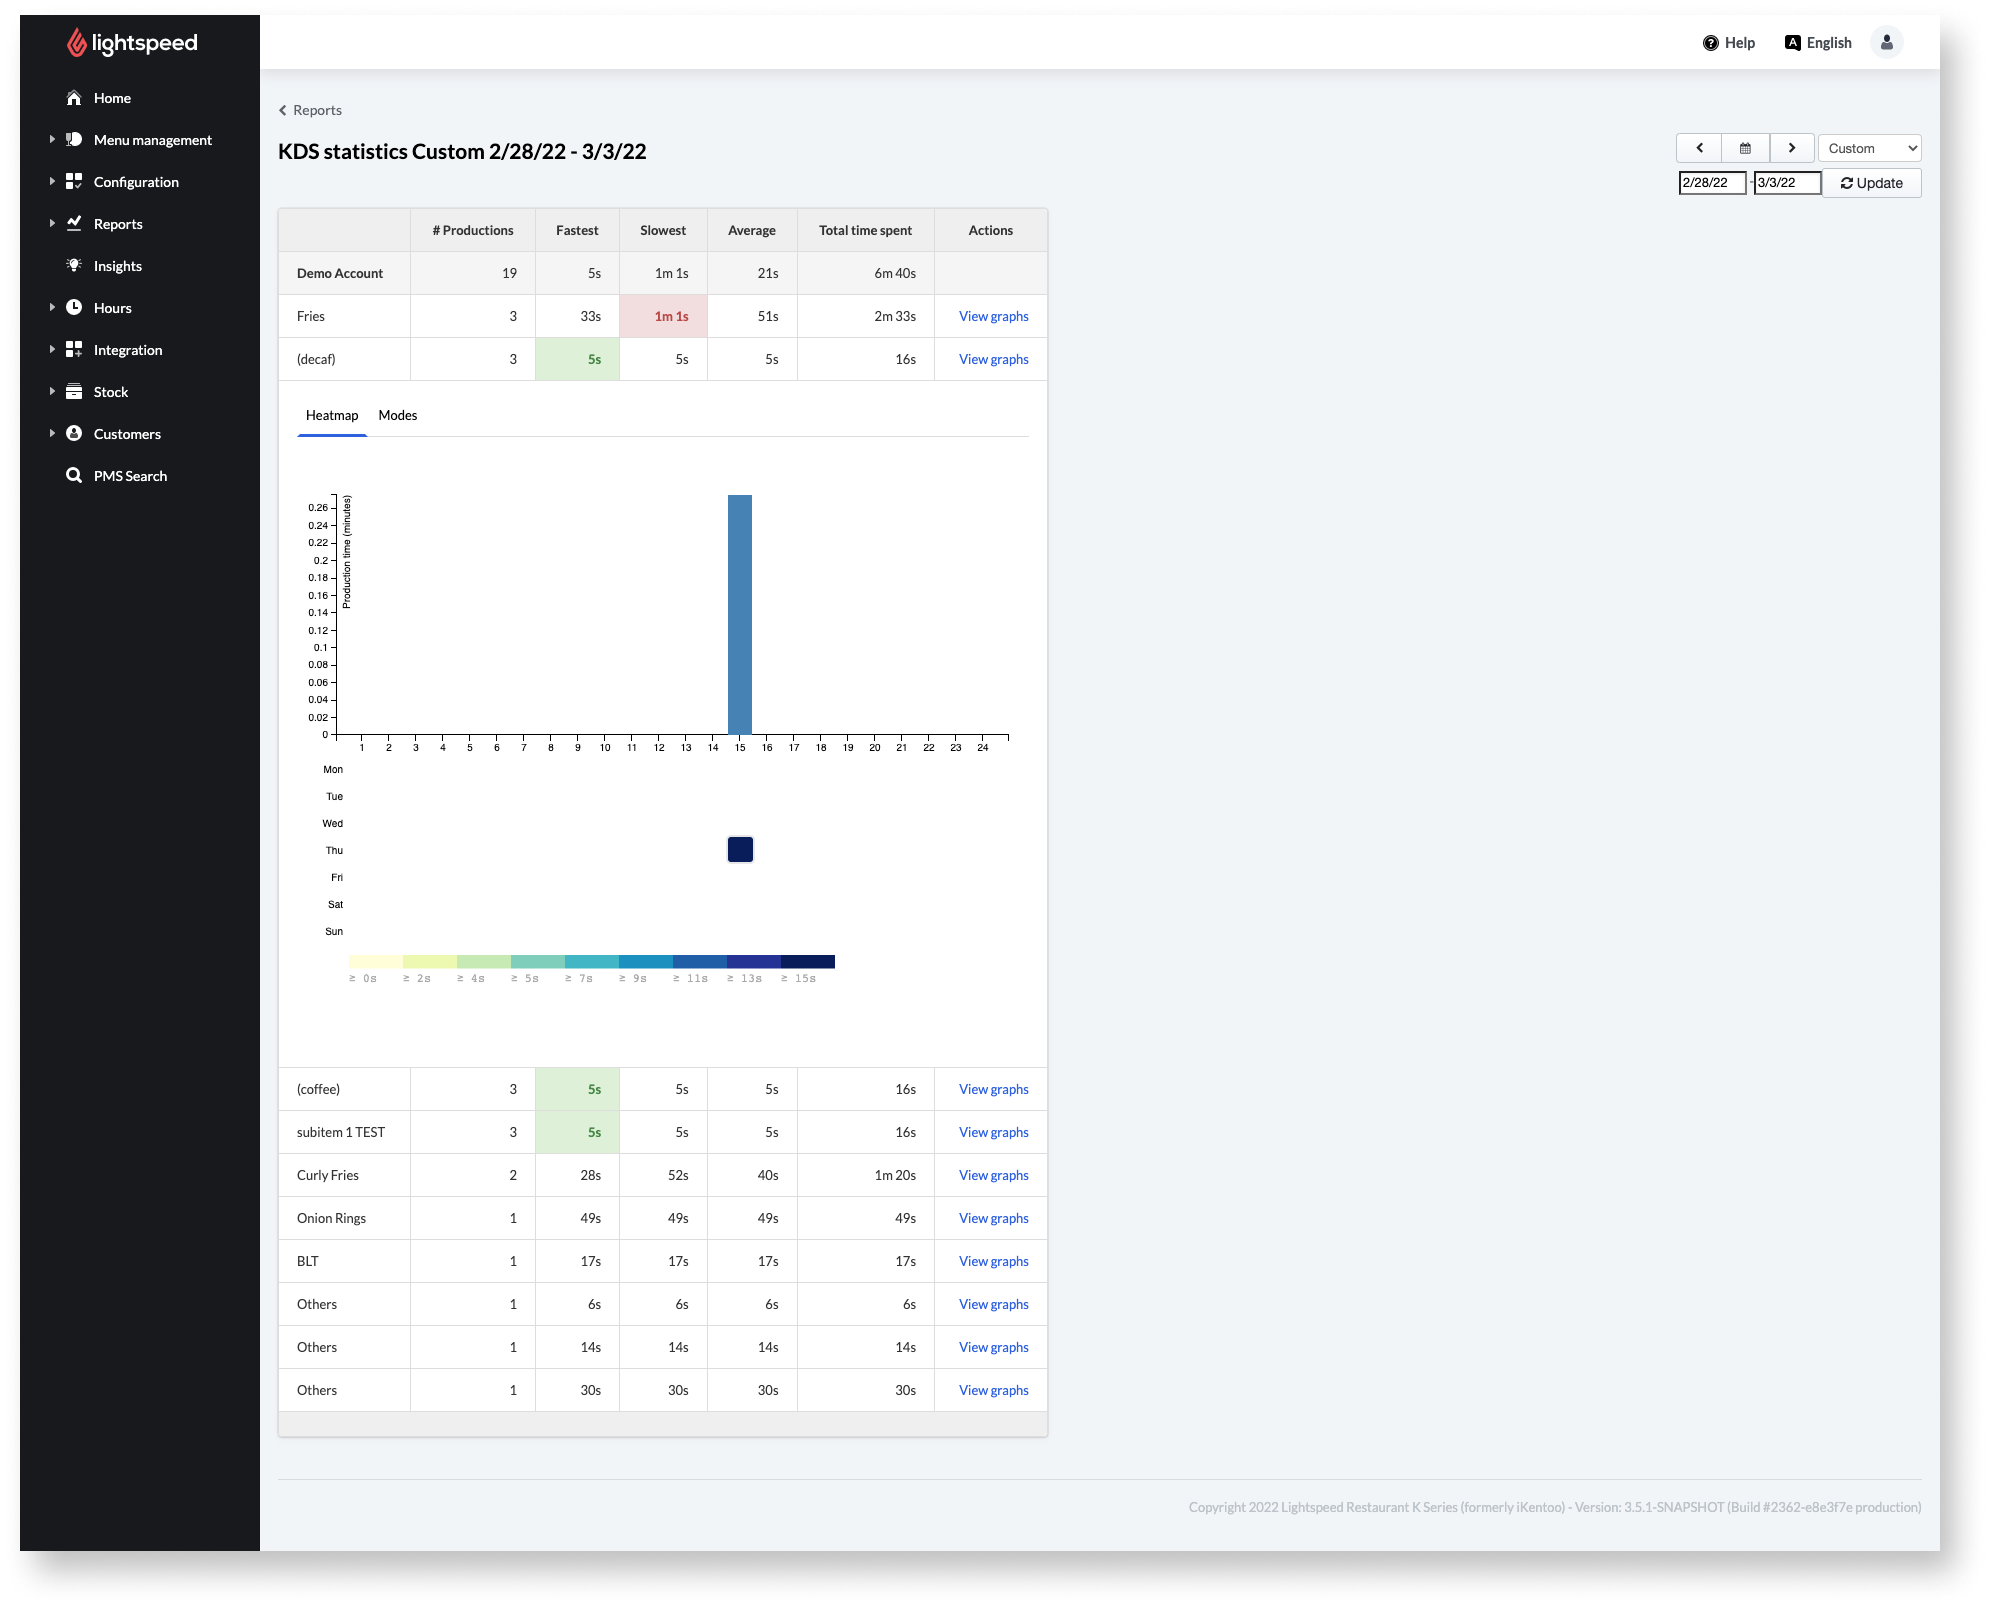
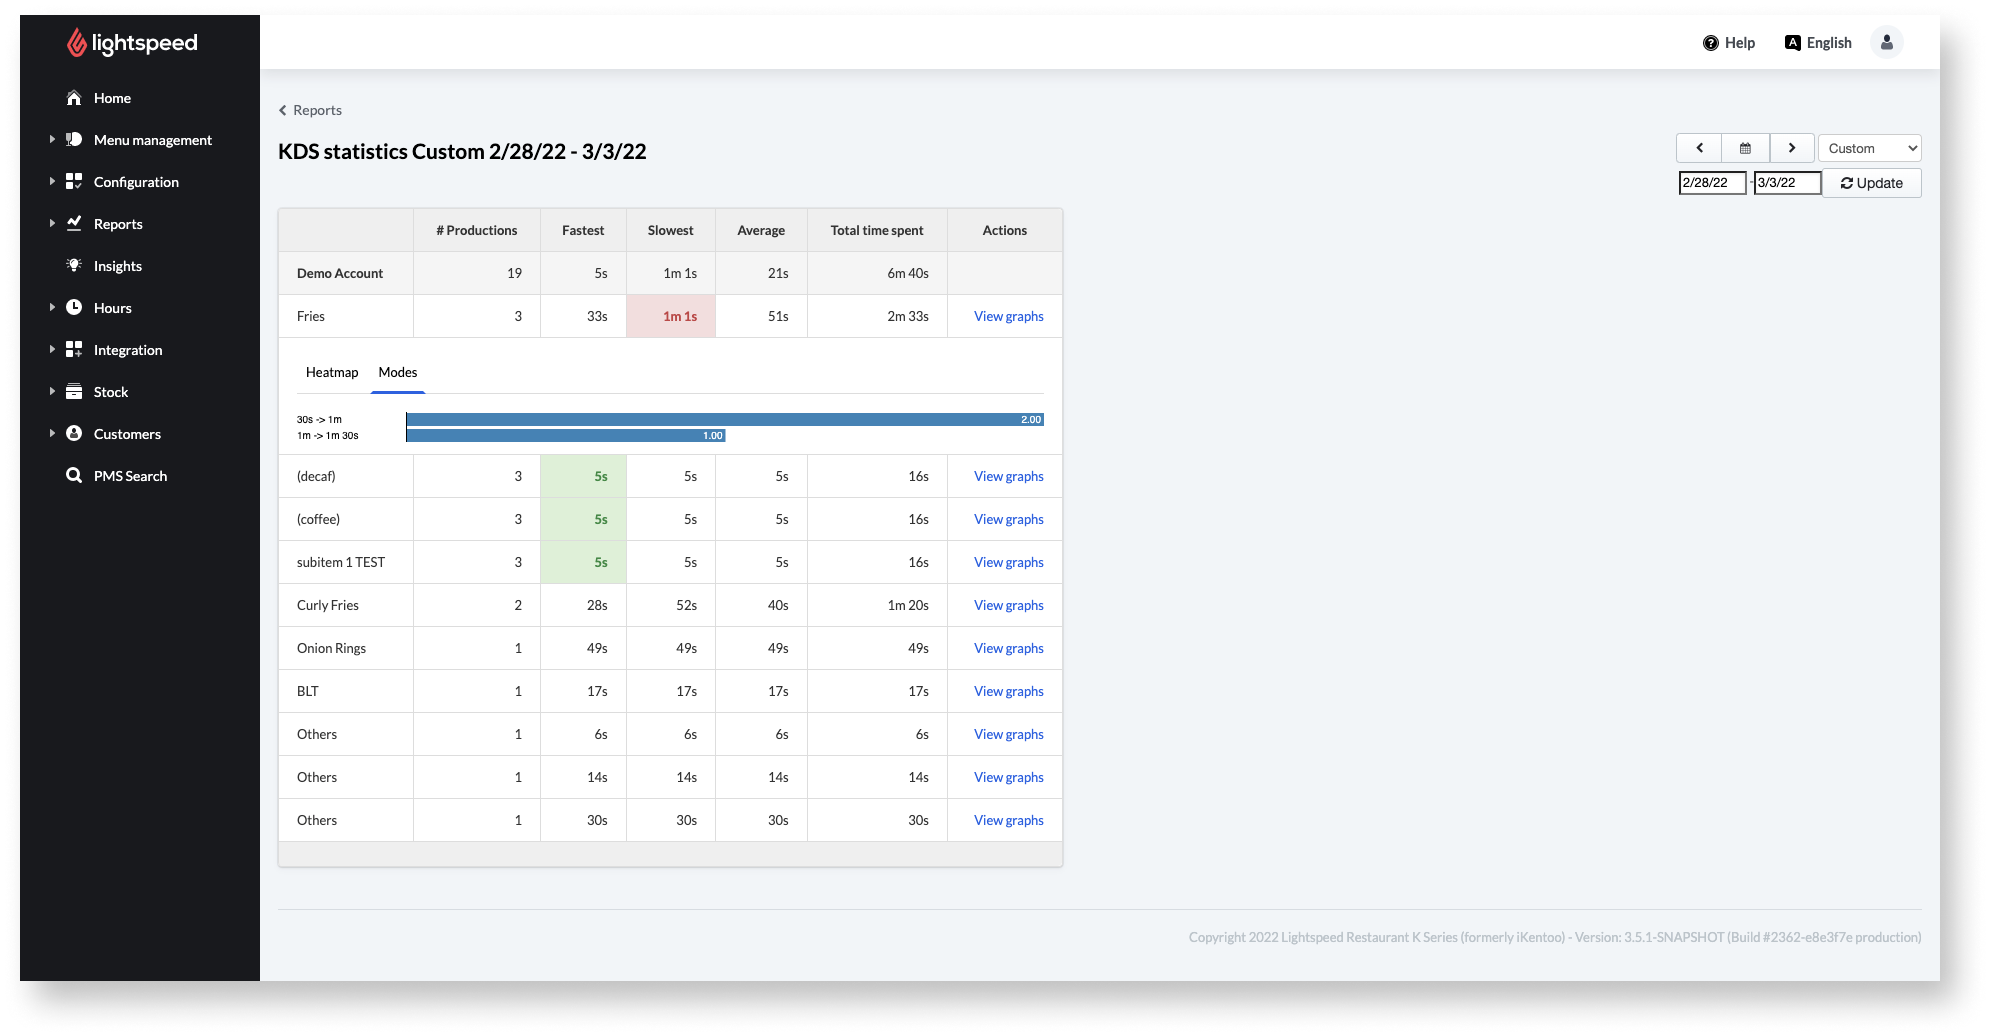
After clicking View graphs within the KDS Statistics report, the two available graphs areHeatmapandModes.Choose the graph you prefer or use both to track a product's average preparation time.
Heatmap (default)
- On the vertical axis, the Heatmap shows a line representing the item's total production time in minutes.
- On the horizontal axis, the Heatmap displays a 24-hour timeline indicating when the item was made during the day.
Note: Hover over a column to get the exact production time in minutes and seconds. - Below the column chart, the item's production time is displayed according to the day of the week. This lets you know which day and time a particular item takes the longest to prepare.
Modes
- Switch to the modes tab to view a time-listing with seconds shown on the left side, representing the item's production time. Bars indicate how frequently the item was created (the exact number of orders appears on the right) at each particular speed.
Comments
0 comments
Please sign in to leave a comment.